
LB5212 Accounting and Finance for Managers
⚫ 5201: Understand the nature of assets, liabilities and income in the context of the accounting model.
SLOS: The ability to analyse and interpret financial statements and understand of the relationship between different financial statements.
https://www.cpaaustralia.com.au/get-involved/academic-institution-support/international: accreditation guidelines/section-technical and professional competency areas and learning outcomes
The aims of the report are:
⚫ To develop skills to conduct a vertical, horizontal and ratio analysis of an Australian listed company.
⚫ To develop skills to interpret and explain in written form the two (2) year performance of a company covering 2021 and 2023 based on the vertical, horizontal and ratio analysis, and other relevant factors that become evident when analysing the company's annual reports.
The report has a word limit of 2000 words (excluding appendices and references).
⚫ The analytical report consists of a full financial analysis and assessment of a company listed on the Australian Stock Exchange.
Instructions:
1. Select a company listed on the Australian Stock Exchange to use as the basis of your analytical report. Obtain copies of that company's most recent Annual Reports. Develop a written report that contains: Cars Singapor Toe
An Executive summary (The first page of your report - one page maximum, double spaced) It is essential that you obtain the JCU resources that describes what 'a report' is, and then demonstrate that you are able to comply with it.
Introduction and explanation of the business and any important contextual information that assists in understanding the financial data you are analysing and presenting. (brief but sufficient to provide context).
• Discussion and critical analysis of financial statements and accompanying material in the context of the particular business and economy, competitors, and any other relevant information and data that enhance understanding of the business's financial situation. In this section you will draw on the vertical, horizontal and ratio analysis you have undertaken, details of which will be in the appendices of your report.
Conclusion about the financial performance and position of the business, how you see its likely future performance and any other relevant conclusion supported by your analysis and discussion.
An appendix containing details of your analysis. Depending on which analytical tools you choose to use, this could include vertical and horizontal analysis, and ratios analysing the business's liquidity, working capital management, solvency, capital structure and gearing. profitability and efficiency and market performance, and other relevant areas that you discuss in the body of your report, trend analysis and so on.
An appendix of the two core financial statements for the years that are analysed. If helpful, an appendix containing other relevant material that enhances your analysis and discussion References used in proper academic format using APA conventions (if you are unsure of how to do this, please consult the library guides) http://bgudes.jcu.edu.au/referencing a Report length of no more than 2000 words, not including appendices or references
Before starting the report, you should read over the rubric, ie, the marking criteria sheet in section 5. You must type the report and use the APA referencing style (see http://bguides.ku.edu.au/apal
Power energy supplier Woodside Energy Group Ltd. (Australia), previously Woodside Petroleum Ltd. They are renowned for using trustworthy and secure operating procedures. In addition to offering lower-carbon services as part of their broader product mix, they are increasing their chances to commercialize novel energy products. Their LNG, in particular, helps their clients meet their decarbonization objectives. Since its founding in 1954, Woodside Energy has grown to employ 5,000 people. According to Woodside Energy (2023), the company's headquarters are situated in H2 Perth, Perth, Western Australia, Australia. Woodside Energy is a publicly traded company that is traded on the Australian Securities Exchange. Its market worth is $68.14 billion. Originally formed as a no-liability company, Woodside Energy was named after the little Victorian town of Woodside. In the 2020 Forbes Global 2000, Woodside Energy was listed as the 1328th-largest publicly traded company globally. They have completed the sell-down of Pluto Train 2, achieved a $6.5 billion net profit after taxes, and awarded H2OK contracts for alkaline electrolyser gear and liquefaction units in agreement with targeted FID readiness in 2023, all under the leadership of their CEO, Meg O'Neill, and Chair of the Board, Richard Goyder.
2.1 Ratio Analysis
2.1.1 Profitability Ratios
The gross profit margin ratio, sometimes referred to as the gross margin, is one type of profitability ratio. Finding out how much money a company makes from selling goods and services after deducting its direct costs is helpful. In other words, it's a simple number that shows how profitable the company is (Noviyana et. al., 2023). It is also advantageous to evaluate how well the business uses labour and raw resources during the production process. The ratio increased from 44.77% to 46.27% from 2021 to 2023, highlighting an increase in sales management and a reduction in the cost of sales to improve gross profitability.
A measure of profitability for MBA assignment expert is the net profit ratio, which contrasts the company's earnings with the total amount of capital raised. Put another way, the net profit margin ratio illustrates the relationship between a company's net profit after taxes and net sales. The ratio decreased from 29.24% to 12.31% from 2021 to 2023, highlighting an increase in operating and finance costs leading to a decrease in net profitability and highlighting the cost management issue at Woodside Energy.
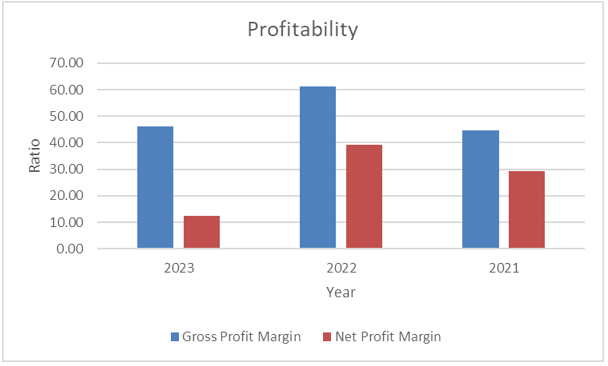
Fig. 2.1.1: Profitability Ratios
(Source: Appendix 1)
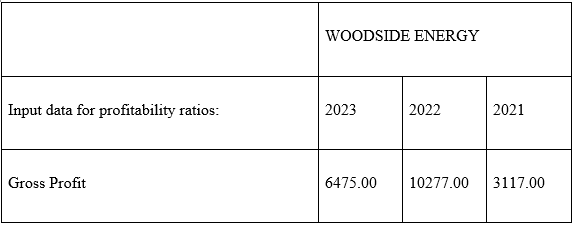

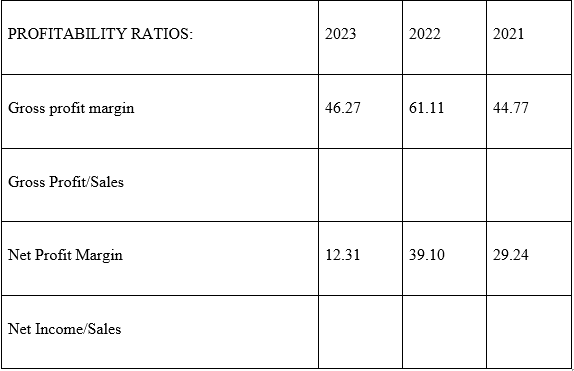
Table 2.1.1: Profitability Ratios
(Source: Appendix 1)
2.1.2 Liquidity Ratios
The current ratio compares a company's current assets to its current liabilities to assess if it can sustainably balance its financing, assets, and liabilities. The current ratio is often seen as a broad measure of financial health since it shows a company's ability to pay down short-term loans. A term is often associated with the assets and liabilities included in the current ratio Warren et. al. (2020). For example, the liabilities in this proportion are usually due within a year. The current ratio of the woodside energy as seen in the above figure is dropped as compared to the previous year. This was 1.63 in 2021 and it decreased to 1.03 and 2023 which can be concern for this company. This indicates a decline in the liquidity position of Woodside Energy to meet its financial obligation. The reason is attributed to an increase in current liabilities related to the current assets.
According to Noviyana et. al., (2023), the quick ratio used to measure short-term liquidity excluding inventories. It is a measure which shows how well a firm can meet its short-term financial obligation by using its most liquid assets. This is a more conservative indicator than the current ratio because it excludes certain current assets. From the above figure, it can be analysed that the quick ratio also fell from 1.55 in 2021 to 1.90 in 2023. This shows a reduced tendency of the firm to cover financial commitment with its most liquid asset because of rising current liabilities as well as decreased inventories.
.png)
Fig 2.1.2 Liquidity Ratios
(Source: Appendix 1)
.png)
.png)
Table 2.1.2: Liquidity Ratios
(Source: Appendix 1)
Equity ratio can be referred to as a financial measure which is utilised in showing how much the firm is using equity to find its operations. It looks at the investments in the assets and their equity amount to see how efficient is any company in handling its obligation at the same time financing its asset. The equity ratio adds up all of a company's assets, current and non-current, and total equity to determine its leverage, or how effectively it can meet its asset requirements without taking on debt (Robinson, 2020). The ratio decreased from 0.38 to 0.14 from 2021 to 2023, highlighting an increase in total debt over total equity and showing increased reliance on debt as a source of financing.
The debt-to-equity ratio of a business may be used to determine how much debt and equity are being used to fund its assets. This indicates how leveraged the business is financially. It is calculated by dividing a company's total liabilities by the entire equity that its shareholders own. The debt-to-equity ratio is a metric that compares an organization's liabilities to shareholders' equity to determine how leveraged or indebted the latter is (Bordeianu and Radu, 2020). The ratio increased from 0.53 to 0.64 from 2021 to 2023, highlighting the increase in equity over total assets and the increased capital resilience of equity financing for its asset acquisitions.
.png)
Fig. 2.1.3 Gearing Ratio
(Source: Appendix 1)
.png)
.png)
Table 2.1.3: Gearing Ratio
(Source: Appendix 1)
2.1.4 Investment Ratio
The EPS metric is among the most significant variables affecting a stock price. Investors may learn about a company's profitability using EPS. A consistent rise in profits per share may be a sign of a company's health and ability to eventually enhance dividends. Estimating corporate value is the main goal of EPS, which calculates a company's earnings per share. Growing profitability for the company is indicated by a rising EPS, and vice versa. There is a decline observed from 206 to 87.50 between 2021 and 2023. This shows less profit available for its shareholders. This indicates lower profitability as well as the value of the company (Brigham and Daves, 2019).
ROE is used to assess how well the firm is able to turn its equity into profit. In this higher ROE is used to suggest the better efficiency of the company. In this, the ROE of the wood energy dropped from 0.14 to 0.05 from 2021 to 2023. This indicates a reduced ROE, company value and lower profitability (Revsine et. al., 2021).
.png)
Fig. 2.1.4: Investment Ratio
(Source: Appendix 1)
.png)
.png)
Table 2.1.4: Investment Ratio
(Source: Appendix 1)
2.2 Vertical Analysis
Vertical analysis refers to the method used in the finance for analysing each account’s proportion as compared to the total assets. This expresses every line item on the financial statement as the total percentage. Woodside Energy's income statements and balance sheets for the fiscal years 2021–2023 may be vertically analyzed to learn more about the distribution of each company's financial elements of total revenue. Woodside Energy often shows a gross profit percentage in terms of sales, ranging from 44.77% to 46.27% from 2021 to 2023, reflecting its dominant position in the market. Woodside Energy's net profit probabilities show a decreasing capacity to leverage profitability, ranging from 29.24% to 12.31% from 2021 to 2023 (Palepu et. al., 2020). Regularly making up between 83.84% and 90.76% from 2021 to 2023 of Woodside Energy's total assets on the balance sheet, general non-current assets show a decreased dependency on current assets. The robust capital structure of Woodside Energy is indicated by its equity tiers, which span from 53.75% to 63.53% from 2021 to 2023. This signals better leverage and a notably reduced reliance on debt. The economic systems and enterprise models of Woodside Energy are ultimately revealed by the vertical evaluation. These show the company's dominance in the market and its capacity to maximize operational performance while preserving stability through a regular equity position and an emphasis on fixed assets (Kimmel et. al., 2020).
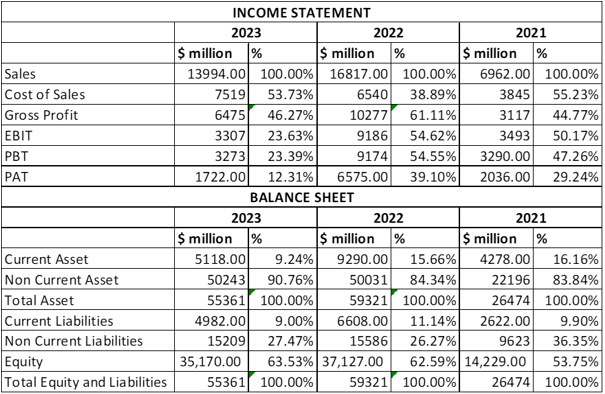
Table 2.2: Vertical Analysis
(Source: Appendix 3)
2.3 Horizontal Analysis
A lengthy period is utilized to evaluate a company's performance using a financial analysis technique known as horizontal analysis. By contrasting financial results from earlier eras with more recent financial outcomes, a firm may more easily determine the direction and magnitude of changes in account balances. A horizontal analysis of the Woodside Energy profit statements from 2022–2023 might provide important details about the organization's long-term financial performance. In 2022–2023, Woodside Energy's revenue dropped by 16.7% from the year before, when it had increased by 141.55%, suggesting issues with sales management (Ginting, 2021). When examining the cost of sales, Woodside Energy saw a 14.37% increase in expenses in 2022–2023, although this increase pales in comparison to the 70.09% increase in 2021/22-22. Conversely, Woodside Energy showed a rising trend but also greater fluctuations. Nonetheless, Woodside Energy's gross income dropped by 37.00% in 2022–2023 as opposed to a rise of 229.71% in 2022–2022, showing challenges in sustaining profitability. Operating challenges were evident in Woodside Energy's profits before interest and taxes, which fell noticeably by 64.00% in 2022–2023 compared to a rise of 162.98% in 2022–2022. The financial indicators exhibit some volatility as well; Woodside Energy's financing costs have increased.
Woodside Energy's current assets decreased by 44.91% in 2022–2023 as opposed to increasing by 117.16% in 2022–2022. Non-current assets increased by 0.42% in 2022–2023 as opposed to growing by 125.41% in 2022–2022. Compared to 2022–2022, when its current liabilities grew by 152.02%, Woodside Energy's liabilities decreased by 24.61% in 2022–2023. In 2022–2023, non-current liabilities decreased by 2.42% as opposed to rising by 61.97% in 2021–2022. In 2022–2023, equity decreased by 5.27% as opposed to a rise of 160.92% in 2021/22 (Fridson and Alvarez, 2022). When considered as a whole, the horizontal assessment highlights Woodside Energy's better economic performance, which was enabled by a significant decline in sales and profit despite challenges maintaining operational effectiveness and profitability.
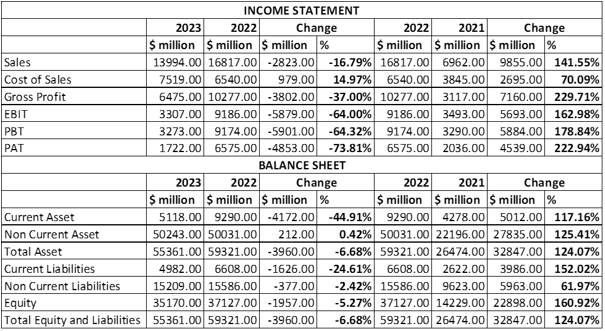
Table 2.3: Horizontal Analysis
(Source: Appendix 3)
.png)
Fig. 2.3.1 Income Trend
(Source: Appendix 4)
.png)
Fig. 2.3.2 Balance Sheet Trend
(Source: Appendix 4)
The financial evaluation of Woodside Energy Group Ltd. describes the advantages and difficulties of the company. Even while the corporation still controls a substantial portion of the market and maintains good gross profit margins, worrying trends in its online profitability and liquidity ratios point to potential problems with rate management and economic stability. The declining profitability ratios indicate difficult situations for maintaining operational effectiveness and profitability when paired with fluctuations in income and costs. However, the company's robust economic structure—as evidenced by its fairness ratings—suggests some degree of equilibrium even in the face of such challenges. In the future, Woodside Energy will have to address issues with pricing and management, increase profitability, hold onto its leading position in the industry, and use its capital structure wisely to handle operational challenges and economic ups and downs.
Annual Report 2021, Woodside. (2021). Shareholder Reports and Investor Briefings—Woodside Energy. [online] Available at: https://www.woodside.com/investors/reports-investor-briefings.
Annual Report 2023, Woodside. (2023). Shareholder Reports and Investor Briefings—Woodside Energy. [online] Available at: https://www.woodside.com/investors/reports-investor-briefings.
Bordeianu, G.D., and Radu, F. (2020). Basic Types of Financial Ratios Used to Measure a Company's Performance. Economy, Transdisciplinarity, and Cognition, 23(2). https://search.ebscohost.com/login.aspx?direct=true&profile=ehost&scope=site&authtype=crawler&jrnl=20675046&AN=148237178&h=8ySX0fjfIITzXbA
PbhJkBDNg0aYqPCxvYwGCtmMllU4IKpZz68oP64YmRgRoOh3SDmYnClVZYQAUKiiQbqYOAg%3D%3D&crl=c
Brigham, E.F., and Daves, P.R. (2019). Intermediate financial management. Cengage Learning. https://thuvienso.hoasen.edu.vn/bitstream/handle/123456789/10265/Contents.pdf?sequence=1
Fridson, M.S., and Alvarez, F. (2022). Financial statement analysis: a practitioner's guide. John Wiley & Sons. https://thuvienso.hoasen.edu.vn/bitstream/handle/123456789/8423/Contents.pdf?sequence=4
Ginting, E.S. (2021). Ratio-Based Financial Performance Analysis of PT. Mustika Ratu, Tbk. Enrichment: Journal of Management, 11(2), pp. 456-462. https://www.enrichment.iocspublisher.org/index.php/enrichment/article/download/124/92
Kimmel, P.D., Weygandt, J.J., and Kieso, D.E. (2020). Financial accounting: tools for business decision-making. John Wiley & Sons. https://web-app.usc.edu/ws/soc_archive/soc/syllabus/20083/14772.pdf
Noviyana, S., Febriyola, A.S., and Koranti, K. (2023). Analysis of Financial Performance Using Liquidity Ratio, Solvency Ratio, Activity Ratio, and Profitability Ratio in Pharmaceutical Sub-Sector Manufacturing Companies On The Indonesia Stock Exchange For The 2018-2020 Period In DKI Jakarta. Jurnal Syntax Transformation, 4(8), pp. 79–89. http://jurnal.syntaxtransformation.co.id/index.php/jst/article/view/788
Palepu, K.G., Healy, P.M., Wright, S., Bradbury, M., and Coulton, J. (2020). Business analysis and valuation: Using financial statements. Cengage AU. https://books.google.com/books?hl=en&lr=&id=IDT6DwAAQBAJ&oi=fnd&pg=PR13&dq=financial+reporting+and+analysis&ots=uJjp7_vi9Y&sig
=yw90JmA17tFYfnr9pXlJu9n-p5A
Revsine, L., Collins, D.W., and Johnson, W.B. (2021). Financial reporting and analysis. McGraw-Hill. https://thuvienso.hoasen.edu.vn/bitstream/handle/123456789/12878/Contents.pdf?sequence=1&isAllowed=y
Robinson, T.R. (2020). International financial statement analysis. John Wiley & Sons. http://www.ir.harambeeuniversity.edu.et/bitstream/handle/123456789/1336/International%20Financial%20S
tatement%20Analysis% 20% 28% 20PDFDrive.com%20% 29.pdf?sequence=1&isAllowed=y
Warren, C.S., Jones, J.P., and Tayler, W.B. (2020). Financial and managerial accounting. Cengage Learning, Inc. https://thuvienso.hoasen.edu.vn/bitstream/handle/123456789/13155/Contents.pdf?sequence=5&isAllowed=y


Essay: 10 Pages, Deadline: 2 days
They delivered my assignment early. They also respond promptly. This is excellent. Tutors answer my questions professionally and courteously. Good job. Thanks!
![]() User ID: 9***95 United
States
User ID: 9***95 United
States
Report: 10 Pages, Deadline: 4 days
After sleeping for only a few hours a day for the entire week, I was very weary and lacked the motivation to write anything or think about any suggestions for the writer to include in the paper. I am glad I chose your service and was pleasantly pleased by the quality. The paper is complete and ready for submission to the professor. Thanks!
![]() User ID: 9***85 United
States
User ID: 9***85 United
States
Assignment: 8 Pages, Deadline: 3 days
I resorted to the MBA assignment Expert in the hopes that they would provide different outcomes after receiving unsatisfactory results from other assignment writing organizations, and they genuinely are fantastic! I received exactly what I was looking for from this writing service. I'm grateful.
![]() User ID: 9***55
User ID: 9***55
Assignment: 13 Pages, Deadline: 3 days
Incredible response! I could not believe I had received the completed assignment so far ahead of the deadline. Their expert team of writers effortlessly provided me with high-quality content. I only received an A because of their assistance. Thank you very much!
![]() User ID: 6***15 United
States
User ID: 6***15 United
States
Essay: 8 Pages, Deadline: 3 days
This expert work was very nice and clean.expert did the included more words which was very kind of them.Thank you for the service.
![]() User
ID: 9***95 United
States
User
ID: 9***95 United
States
Report: 15 Pages, Deadline: 5 days
Cheers on the excellent work, which involved asking questions to clarify anything they were unclear about and ensuring that any necessary adjustments were made promptly.
![]() User ID: 9***95 United
States
User ID: 9***95 United
States
Essay: 9 Pages, Deadline: 5 days
To be really honest, I can't bear writing essays or coursework. I'm fortunate to work with a writer who has always produced flawless work. What a wonderful and accessible service. Satisfied!
![]() User ID: 9***95
User ID: 9***95

Essay: 12 Pages, Deadline: 4 days
My essay submission to the university has never been so simple. As soon as I discovered this assignment helpline, however, everything improved. They offer assistance with all forms of academic assignments. The finest aspect is that there is also an option for escalation. We will get a solution on time.
![]() User ID: 9***95 United
States
User ID: 9***95 United
States
Essay: 15 Pages, Deadline: 3 days
This is my first experience with expert MBA assignment expert. They provide me with excellent service and complete my project within 48 hours before the deadline; I will attempt them again in the future.
![]() User ID: 9***95 United
States
User ID: 9***95 United
States
