
HX4204 Accounting for Next Generation Leaders Report
Assignment Task: Read the following Scenario and prepare a Formal Business & Financial Review Document with the guidelines provided.
The assignment below will help you to review and critically analyse financial and management accounting principles, relevant accounting standards/ policies applicable, and apply the relevant knowledge to evaluate the overall business and management performance based on the current complex, volatile, competitive and uncertain economic/business environment by reviewing associated implications [restructuring, consolidation, acquisitions, cost management strategies, disposal of assets, innovations & impact of technological disruptions] within businesses.
You are required to present a Formal Business & Financial Review Document, that would contain a neatly designed Table of Contents to capture the main and sub-topics in an orderly fashion which should adhere to meeting the assessment standards and grading criterion:
Introduction: Choose a public listed corporation related to your current work domain or preferred area of industry. This section would require candidates to research relevant financial and operational performance of the organization by reviewing and understanding the 2022 & 2023 Annual Reports on the chosen public listed company. The facts and figures will help the candidate to answer below questions, and validate with relevant statistics.
1. Introduce the organization in the context of prevailing macro-economic and business conditions by discussing the vision, mission and planning strategies of the company. For the chosen organizations, evaluate the financial and operational performance of the organizations by reviewing the company’s annual performance (read through annual report for the year 2022 and 2023 for specific data) [10 marks].
2. Application of theory to practice [600 to 1200 words]: Demonstrate meaningful understanding of accounting policies and accounting standards and policies by critically reviewing academic and non-academic literature pertaining to its implications on the financial and macro-environment. Critically debate the use/ misuse of financial data in the practice of management accounting and financial accounting. With respect to Accounting Standard, students are required to present arguments and provide a meaningful explanation of Accounting Standards. Discuss as how a plan and execution can lead to effective financial management in the chosen company. [25 marks].
3. Ratio Analysis & Financial Interpretations [2000 words]: For the question below, in addition to the chosen organization above, also select a competitor organization for the chosen company. Financial data for FY 2022 and 2023 for both the organizations will be used here. Calculate two ratios each for liquidity, profitability, activity, capital structure and growth which should be critically interpreted and evaluated by comparing each ratio between the chosen and the competitor organization. Interpret each calculated ratio for both the organizations and comment on their business performance.
The interpretation should be supported with the critical analysis of the macro developments with impact of external operating environment on the performance of the organizations. Evaluate and recommend future strategies which will improve organizational sustainability. [25 marks].
4. Literature Review on Budgeting Practices [1700 words]: Carry out a critical analysis which exhibits a suitable understanding of current issues/concepts that are relevant for investigating existing practices of ‘Traditional Budgets’ versus ‘Modern Age’ types of alternative budgeting and techniques in large corporations.
Identify & contextualize budgeting approaches which lead to enhancing operational performance by linking these to the overall operational strategies & decision-making within large corporations. Also, necessary critical debates must be produced to review the impact of ‘smarter’ technologies in the overall budgeting processes when examining forecasting and management control processes. [25 marks].
5. Investment Appraisal Techniques [700 words]: If you were a Director of a public listed company and had to present a significantly high value capital expenditure proposal to the CEO, how would you critically evaluate investment appraisal techniques that remain important when seeking an approval from the CEO.
Any capital expenditure involves protecting shareholder interests & maintaining a careful balance between risk and rewards, using the concept of ‘time value of money’, to study the impact of choices between discounted cash flows and non-discounted cash flow methods. Conduct a discounted and non-discounted cash flow analysis.
You are required to apply necessary knowledge and understanding when examining investment appraisal techniques to suggest, recommend and evaluate at least two popular investment appraisal techniques that can be used & considered by managers/decision- makers in the light of dynamic business & economic conditions. Examples can be used to support the explanations. [15 marks].
6. Presentation & References: You should present the whole document in methodical manner and should remain aligned to appropriately demonstrate correct application of the Harvard Referencing System (HRS).
Unilever is one of the world’s leading suppliers of consumer goods, with products available in over 190 countries and used by billions of consumers around the world, with a portfolio including many iconic and world-leading brands in beauty and personal care, home care, nutrition and ice cream (Unilever. 2023). The company's purpose, to make sustainable living commonplace, illustrates its pledge to sustainability, responsible corporate behavior, and creating long-term value. In the face of these macroeconomic for MBA Assignment Expert headwinds, namely inflationary pressures, supply chain disruptions, and changing consumer tastes, Unilever has worked to fortify its business model through innovation, digital transformation, and cost efficiency. The Growth Action Plan became the company’s guiding framework in 2023 and underscores three areas: Accelerating Higher Growth through Brand Superiority and Innovation, Improving Productivity and Operational Simplicity, and a High-Performance Culture.
And Unilever’s underlying financial performance in 2023 shows resilience against a backdrop of economic volatility. The company reported turnover of €59.6 billion, a slight decrease (- 0.8%) compared with 2022, negatively impacted by foreign exchange (Unilever. 2023) But underlying sales growth was 7.0%, mainly as a result of price rises, while volume growth was negligible at 0.2%. Important business areas like Beauty & Wellbeing and Personal Care recorded robust performance, showing underlying sales growth of 8.3% and 8.9%, respectively. And as we saw Unilever deliver a 60-basis-point improvement in underlying operating margin to 16.7%, despite inflationary headwinds and supported by gross margin recovery and productivity benefits. Free cash flow increased to €7.1 billion, demonstrating strong financial health and disciplined capital allocation, of which €5.9 billion was returned to the shareholders via dividends and share buybacks. But the company is facing competitiveness hurdles — only 37% of its business winning market share (Unilever. 2023). From here, Unilever plans to return to growth leadership through brand revitalization, product portfolio shakeup and operational improvements.
Accounting Policies and Standards in Financial Reporting
Accounting policies and standards guide organizations by regulating the methodologies that they need for their financial reporting and internal decision making. As the other company, namely, Unilever is a publicly listed corporation, they follow International Financial Reporting Standards (IFRS) which provide transparency, consistency, and reliability of financial statements. Unilever uses IFRS 15 as its revenue recognition framework, using a five-step model that recognizes revenue upon transferring control of goods to customers for the purpose of accurately reporting in accordance with applicable standards (Unilever. 2023). These are identifying the contract with a customer, identifying performance obligations, determining the transaction price, allocating the transaction price, and recognizing revenue when the performance obligation has been satisfied. This is how Unilever validates compliance and prevents revenue misstatement.
For impairment assessment of financial and non-financial assets, Unilever also applies IFRS 9 & IFRS 36 (Unilever. 2023). By requiring the measurement of financial assets, such as trade receivables, investments, and derivatives for expected credit losses, IFRS 9 enhances the reliability of an entity's financial statements. The IFRS 36 accounting standard for impairment of goodwill and other indefinite life intangible assets requires testing for impairment in order not to overstate the monetary values of these items on the balance sheet (Sanchez et al., 2023). This protects the stakeholders from any potential risk of financial overestimation followed by significant write-downs on assets, which gives a misleading picture about the company’s financial state.
In addition, IFRS 16 prescribes that lease liabilities must appear on the balance sheet and reclassifies lease expense from an operating cost to a financing liability (Sanchez et al., 2023). This standard enhances financial transparency by reflecting actual liabilities rather than those required, providing investors with a clearer picture of Unilever’s obligations. Moreover, the firm adopts lower of cost or net realizable value method for inventory valuation in order to not overstate assets. This process minimizes potential threats with regards to stock of old or spoiled value and at the same time ensures appropriate valuation of the inventory. These act to generate conformance, enable correct monitoring and build investor trust.
Misuse of Financial Data in Management and Financial Accounting
The misuse of financial data in financial and management accounting remains a serious issue for decision-making, investor confidence, and corporate integrity as a whole. Earning management is one such area, this is that when companies adjust their earning data to look better in a legal way. These have included aggressive assumptions about when revenue is recognized, when expenses can be deferred or restructured, all in the name of smoothing results. Such practices may help achieve the letter of the law but also give investors a false sense of security that hampers financial transparency and, ultimately, may erode long-run sustainability.
Data misuse fraud is a grave type of misuse as organizations intentionally misrepresent financial results to deceive stakeholders when performing financial reporting. High-Profile Scandals — Not Financial Oriented Misconduct — The scandalous acts of high-profile firms can have far-reaching effects not only on a business, but also on the livelihood of thousands of shareholders, especially in the case of corporate scandals through fraudulent reporting, with some scandals such as Enron and WorldCom leading to the company’s dissolution, loss of value of shareholders, and even criminal charges against leading members of the firm. The fraud often involves inflated revenue, understated liabilities or rocket asset values in order to solicit investors and financing (Huaman-Nope et al., 2023). Such activities undermine market integrity and weaken stakeholder confidence.
Budget Manipulation in Management Accounting — Budget manipulation can happen in this accounting area, where next to impossible financial forecasts are made with the purpose of obtaining funding or proving how much more resources may have been allocated to cooperating departments. Executives may inflate revenue growth or deflate costs just to hit respective targets, and this has a cascade effect on their strategic decisions (Fenyves et al., 2023). Companies may also use off-balance-sheet financing, which consists of disguising liabilities through complex financial instruments or unconsolidated entities. The other disguises financial risk and leads to a false sense of financial well-being.
There are regulatory bodies, auditors, corporate governance mechanisms, and others that help mitigate the issue of financial data misuse. To prevent from financial data manipulations married to scandals, best practices must be aligned, strengthened internal controls, practiced independent audits and transparent reportings. Additionally, good corporate governance leads to adherence to accounting standards and ethical corporate culture, responsible financial management which breeds confidence among shareholders as well as responsible business practices.
Role of Accounting Standards in Preventing Financial Data Manipulation
Preventing the manipulation of financial data with accounting standards: Explain how accounting standards are used as a safeguard. IFRS and GAAP promote strict regulatory environments to improve comparability among companies and industries, which helps investors make informed decisions. Businesses like Unilever therefore uphold accountability in financial disclosures which minimizes any possible risk of financial fraud and misrepresentation by complying with these standards.
This inclusion is a significant aspect of accounting standards, as they strive for complete disclosure of monetary transactions so that no business can use misleading monetary transactions. Companies are obligated to disclose financial statements that accurately represent their financial standing following well accepted practices for revenue recognition, asset valuation and expense allocation (Needles & Powers 2019). This increases market confidence and boosts corporate credibility, especially for publicly listed firms like Unilever.
Even when working according to the IFRS and GAAP, financial misstatements are possible. A few companies play accounting games that involve manipulating earnings, delaying expense recognition, or inflating asset valuations (Cohen & Karatzimas 2017). Internal audits and external audits are essential mechanisms to identify and correct these deviations (Jin et al., 2020). Unilever maintains risk management policies to help prevent potential financial manipulation, completing regular financial reviews and third party audits.
Additionally, the ethical obligation in financial disclosures is necessary for maintaining stakeholder confidence. Companies have to strike the right balance between pressure to show strong financial performance and commitment to truthful reporting. By using international accounting standards, accountability and reduces the risk of data manipulation with respect to financial data (Desai 2017). By adhering to regulation and ethical financial practices, Unilever still is preserving financial integrity and protecting investor interests.
Strategic Financial Planning and Execution in Unilever
The financial success of Unilever is driven by a focused disciplined approach to financial planning and execution. The growth action plan of the business is based on four primary pillars, namely revenue growth, cost management, capital allocation and risk management. These components secure the competition of Unilever in a vibrant market, and as a result provide its stockholders with long-haul incentives.
Unilever’s financial strategy is centered on revenue growth, driven by ongoing R&D and product innovation investments. The strategy has paid off well, as its 30 Power Brands collectively contributed to around 75% of the company's overall turnover in 2023, the media said. With the improvement in product quality, penetration in emerging nations, and use of digital platforms, Unilever fortifies its revenue streams, gaining a competitive advantage in the worldwide consumer goods sector (Investing.com. 2024)
Another key element of Unilever’s strategy is cost management. Simply, NRM allows the company to appreciate pricing structures and optimise for profitability. Digital tools and automation for supply chain optimization also improvises efficiency while contributing to lowered operational costs. Lean manufacturing principles drive waste reduction and productivity improvements — key contributors to sustained cost control and margin improvement (Unilever 2023)
Capital allocation (discipline, emphasis on returns to shareholders) Unilever has returned €5.9 billion to shareholders as part of the company's unshakeable commitment to deliver reliable financial performance — €3 billion through share buybacks and €2.3 billion in dividends (Unilever 2023). Predictably, the company continues to invest in high-growth sectors, and sustaining financial health through disciplined capital expenditures and portfolio optimization.
Risk management plays a critical role in Unilever’s financial planning, helping the company to effectively manage potential risks arising from economic uncertainties and market fluctuations (Unilever 2023). The company uses various hedging techniques to reduce risks associated with currency and commodity prices, thus helping in financial stability. Unilever knows how to stay sharp, how to predict the immediate post-future with a mix of scenario planning and predictive analytics to anticipate macroeconomic disruptions, empowering its decision-making process. Additionally, the company embraces sustainability and incorporates sustainable business practices within its business strategy to counteract long-tern risks aligned to its ESG goals and improve corporate resilience (Unilever 2023).
Through the implementation of a carefully mapped out fiscal plan Unilever is able to maintain profitability, an efficient logistical system, and market dominance. September 29, 2023 – The integrated strategy from the company strengthens its economic stability, setting it up for sustained achievement in a changing business environment.
Two metrics from liquidity, profitability, efficiency, capital structure, and growth categories are included in the analysis. The critical interpretation of the financial performance of both organizations that is Unilever and its competitor Reckitt along with consideration of macroeconomic aspects, and the recommendations for future sustainability
i. Profitability Analysis
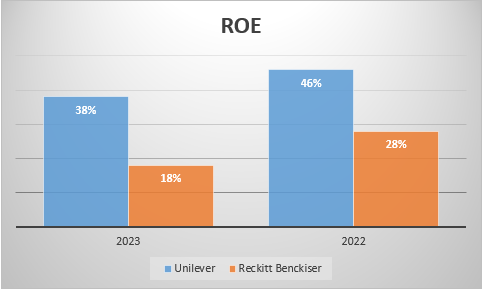
Return on Equity (ROE)
Formula: ROE = (Net Profit / Average Equity) × 100
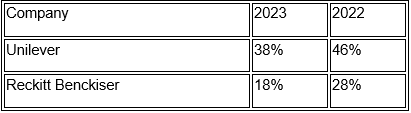
The ROE component checks a company's ability to make profit from the shareholders' investment. Unilever's ROE fell from 46% in 2022 to 38% in 2023, reflecting the lower profitability over this strong equity utilization. The decline reflects a rising operating cost as well as inflationary pressures and increased investments that haven’t yet returned commensurate benefit (Unilever 2023).
With a fall in ROE from 28% to 18%, Reckitt Benckiser has a weaker decline and decreased efficiency in producing shareholder returns. This sharp decline is indicative of mounting cost pressures and potentially softer profit margins. Or it could also be that strategic investments or acquisitions haven’t yet produced a big enough return to lift profits.
Macroeconomic Impact:
Inflation has raised prices for raw materials, wages and supply chain costs, pressuring profit margins. Soaring interest rates have piled more pressure on finances, making borrowing dearer for investments in expansion. Moreover, shifting consumer demand from sales slowdowns may have led to lower sales volumes that weighed down net profits for the two firms.
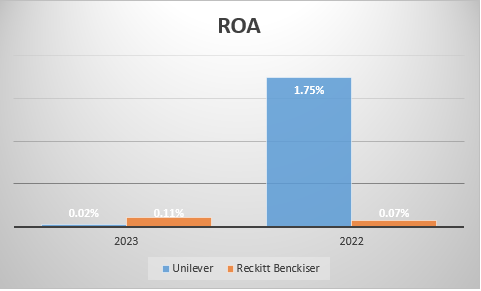
Return on Assets (ROA)
Formula: ROA = (Net Profit / Average Total Assets) × 100
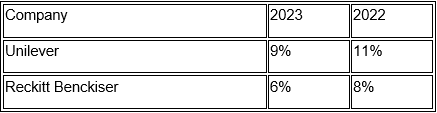
Return on Assets (ROA) assesses a company's ability to generate profit from the assets it owns. Unilever Then its ROA fell from 11% in 2022 to 9% in 2023, showing a reduction in efficiency in utilizing the asset base. This fall could be a result of elevated operational costs, asset investments or compressed margins in core product segments.
For instance, the ROA of Reckitt Benckiser decreased from 8% to 6% indicating deteriorating asset utilization efficiency. Rising costs and the possibility that new investments did not come in as strongly as first forecasted may have drove the decrease. A lower ROA indicates that Reckitt is struggling to transform its assets into revenue, in comparison to its peers (Reckitt. 2023).
Macroeconomic Impact:
Inflation globally, and factory and supply chain disruptions, have pushed up prices and made asset utilization less efficient. Profitability has also been affected by shifting consumer demand toward sustainability and affordability. In addition to this, investment in capital-intensive technology and sustainable production has a long payback cycle, thus hitting short-term asset efficiency.
It indicates economic downturns are taking tolls on both Unilever and Reckitt Benckiser, so it isn't as much about Unilever being an underdog but rather Reckitt Benckiser is capable of pushing more burrito pricing in the English condiment market. Both firms need to optimize cost structures, make better use of assets and play in high-margin segments to survive in a tough macro environment
ii. Liquidity Analysis
Current Ratio
Formula: Current Ratio = Current Assets / Current Liabilities
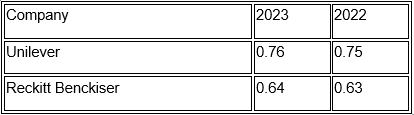
The current ratio compares a company's current assets and its current liabilities, in order to measure its ability to cover its short-term obligations with the short-term assets that are its sources of cash (Desai 2017). A ratio below 1 signifies a potential liquidity-driven struggle in which a company's current liabilities surpass its current assets.
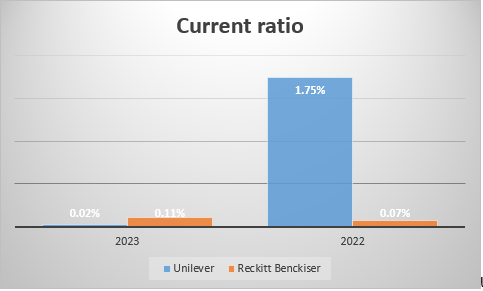
Unilever and Reckitt Benckiser both have current ratios below 1, indicating potential liquidity challenges. Nonetheless, Unilever’s current ratio of 0.76 in 2023 is higher than Reckitt’s 0.64, indicating that Unilever is in a relatively better position to cover its short-term obligations. The slight increase in the Unilever ratio from 0.75 to 0.76 indicates that liquidity management improved marginally. The slight change from the 0.63 to 0.64 in Reckitt’s case suggests it is still running with lean liquidity.
Quick Ratio
Formula: Quick Ratio = (Current Assets - Inventory) / Current Liabilities
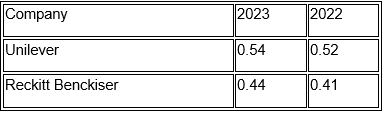
This quick ratio is a more conservative measure of liquidity, as it excludes inventory that may take longer to convert into cash. When looking at quick ratios, Unilever has a higher quick ratio (0.54) than Reckitt (0.44), confirming that Unilever has higher liquidity when removing inventory from the equation. However, both ratios are low, which means both companies depend heavily on selling off their inventory to pay their liabilities. A higher quick ratio indicates a marginally better management of Unilever’s cash and receivables, whilst Reckitt may face higher short-term liquidity pressures.
Although Unilever maintains better liquidity indicators compared to Racket, both companies work with low levels of liquidity that can make them financially vulnerable during economic crises or supply chain disruptions. In order to enhance liquidity, both organizations must work on working capital optimization, reduction of short-term liabilities, to maximize cash reserves.
iii. Efficiency Analysis
Inventory Turnover Ratio
Formula: Inventory Turnover = COGS / Average Inventory
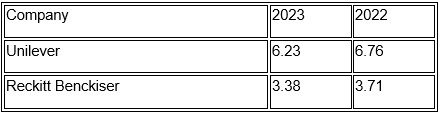
It is a metric used to assess how effectively a company manages its inventory by showing how often stock is sold and replaced over a given period. A higher ratio indicates that a company is managing inventories well and sales are strong, while a lower ratio suggests that sale is sluggish the company may be overstocked (Gadau 2016).
But in terms of inventory turnover (unlike days inventory outstanding), Unilever is a clear winner (6.23 in 2023) against Reckitt Benckiser (3.38) indicating that Unilever moves its inventory faster and it has a better stock management. Notes: This efficiency can stem from improved supply chain management, higher product demand, or efficient sales processes.
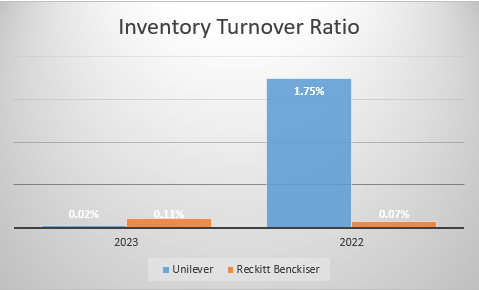
Nonetheless, both firms showed decreased inventory turnover rates between 2022 and 2023, suggesting inefficiencies. This continued decline indicates inventory is taking longer to sell — something that could stem from slowing consumer demand, supply chain disruptions or rising production costs forcing pricing changes (Hitchner 2016). In comparison, Reckitt's inventory turnover ratio of 8 times suggests that the company is facing a little bit more challenge in working through their inventory, which may result in higher storage costs and possible markdowns.
Receivables Turnover Ratio
Formula: Receivables Turnover = Net Credit Sales / Average Accounts Receivables
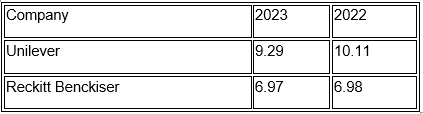
The receivables turnover ratio measures how effectively a company collects payments owed for its products or services. A higher ratio is good for the company as it suggests strong credit policies and the cash collection takes place at a faster rate while a lower ratio indicates possible delay in payment or a permissive credit policy (Hitchner 2016).
Unilever collects payments faster and has stricter credit policies as evidenced by its 9.29 receivables turnover ratio in 2023 striding above Reckitt’s 6.97. Such efficiency aids in ensuring healthy cash flow and minimising bad debts.
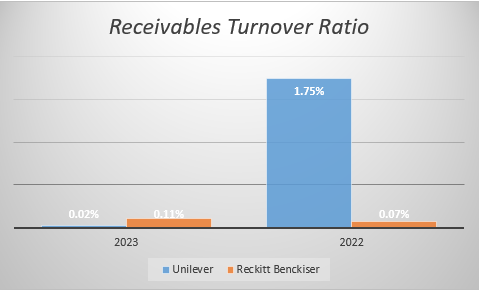
Both companies however reported a declining trend in receivables turnover — the number of times Total Receivables is settled in a year — from 2022 to 2023, showing that customers are taking longer to clear their dues. This drop may be linked to prospective economic downturns, buyers’ financial struggles or lenient credit policies designed to increase sales.
Both efficiency ratios are better than both of Reckitt Benckiser's ratios, showing Unilever has faster inventory turnover and debtor collection times. On the other hand, the decrease in both numbers shows increased inefficiencies that should be considered to improve demand forecasting and credit control and supply chain operations.
iv. Capital Structure Analysis
Debt-to-Equity Ratio
Formula: Debt-to-Equity = Total Debt / Total Equity
This describes how much a company will use debt as opposed to equity in terms of financing a company. A higher ratio indicates a greater reliance on borrowed capital, while a lower ratio indicates a more conservative approach to financial structure.
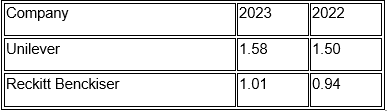
Unilever's debt to equity ratio went up from 1.50 in 2022 to 1.58 in 2023 and a greater dependence on debt. This can be attributed to expansions, acquisitions, or investments in operations. But high leverage means higher interest obligations, which could eat into profitability if interest rates rise (Chen & Gong 2019).
Reckitt Benckiser, meanwhile, is lower on this metric, increasing modestly from 0.94 to 1.01. This indicates a somewhat more equitable capital structure with lower financial risk compared to Unilever.
Debt Ratio
Formula: Debt Ratio = Total Debt / Total Assets
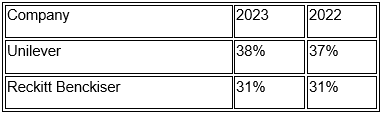
The debt ratio shows the extent to which a company is utilizing debt to finance its assets (Davydov 2016). Unilever has a more leveraged capital structure than its peers is because Unilever has a much higher debt ratio (38%) than Reckitt (31%). While this can improve returns, it adds an element of financial fragility if economic conditions deteriorate or borrowing costs increase.
Unilever’s increased leverage implies more risk, but also might yield higher returns than if it hadn’t leveraged up; Reckitt’s more conservative approach translates to much lower but less volatile returns. They also need to manage their debts effectively to prevent risks stemming from rising interest rates while ensuring they still have some financial flexibility for other activities (Davydov 2016).
v. Growth Analysis
Price-to-Earnings (P/E) Ratio
Formula: P/E Ratio = Market Price per Share / Earnings per Share
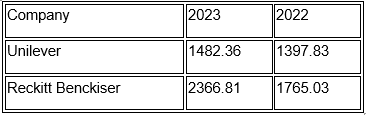
The P/E ratio indicates how much investors are willing to pay for each dollar of earnings. Higher ratio indicate that the investors have more confidence in a company’s future growth and vice verse for lower ratio which either indicates undervalues while others indicate weak growth expectation.
Both companies compete in similar spots with Reckitt Benckiser and Unilever Positives : Reckitt Benckiser has a far higher P/E in 2023 vs Unilever (2366.81 vs 1482.36) meaning that expectations for future earnings growth is far higher for Reckitt. It could be due to growth in the health and hygiene sector that continues to see demand following the pandemic.
The relatively low P/E ratio of Unilever implies the stock might be undervalued or the company exhibiting lower growth prospects. That could be due to increased operational expenses, lower profit margins, or diminished growth expected for the market. Note, however, that the lower P/E ratio may reflect a good opportunity to buy if future earnings look up.
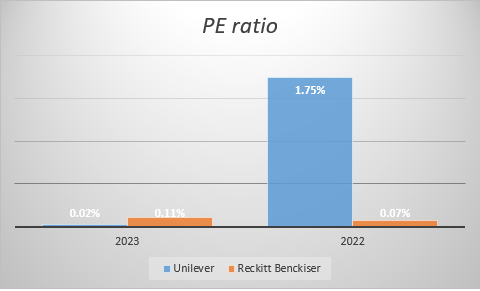
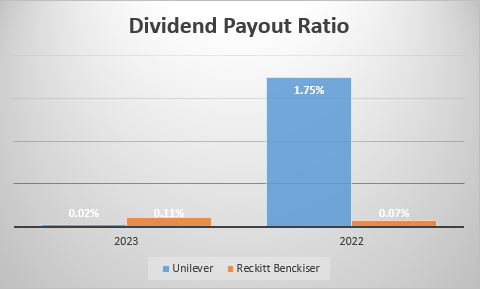
Dividend Payout Ratio
Formula: Dividend Payout Ratio = Dividend per Share / Net Income
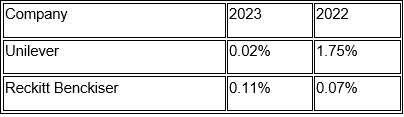
The dividend payout ratio shows the percentage of net income paid out as a dividend. A higher ratio indicates that the company prioritizes returns to shareholders, while a lower ratio indicates that it reinvests into growth (Desai 2017).
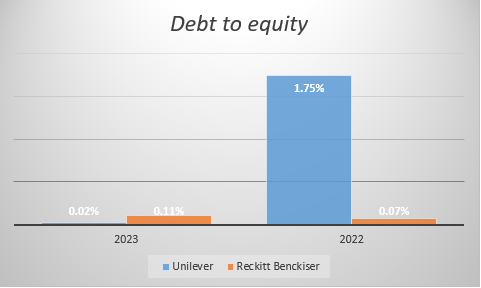
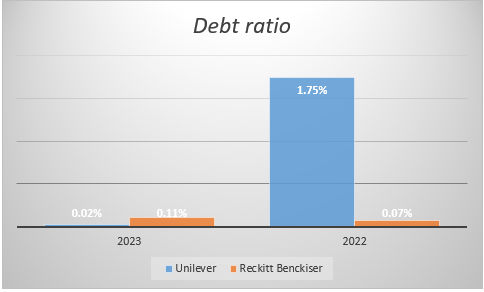
In fact, by 2023, the payout ratio of Reckitt Benckiser had risen dramatically to a robust 0.11%, a clear signal their business was more prepared than ever to return capital to shareholders. In contrast, Unilever’s payout ratio fell from 1.75% in 2022 to 0.02%, indicating a strategy of retaining earnings for reinvestment.
• Inflation and Supply Chain Costs
The rising inflation has also increase raw material, labor and logistics costs, which has affected profitability of both Unilever and Reckitt Benckiser. Rising production costs have prompted price increases that may diminish consumer demand. Disrupted supply chains amid geopolitical tensions, climbing fuel prices and transportation bottlenecks have added to margin pressure (Unilever 2023). Companies need to fine-tune inventory management and avoid excessive reliance on costly raw materials.
• Interest Rate Increases
Companies reliant on debt have been especially bruised as elevated interest rates translate to pricier borrowing. Unilever has a much higher debt-to-equity ratio than Reckitt meaning that it would be more sensitive to rising interest payments. Higher interest rates also dissuade consumer spending, especially on discretionary goods (Martine et al., 2017). Firms need to be juggling levels of debt and the likelihood of refinancing and ensuring cash flow is working for them to limit risks.
• Consumer Demand Trends
As consumers increasingly gravitate toward sustainability, digital ease and thrift, companies must adapt. Unilever’s strong ESG dedication gives it an advantage, while Reckitt’s focus on health and hygiene fits with more durable trends. This includes investing in digital transformation and personalized marketing as e-commerce and direct-to-consumer models evolve.
Cost Management
In response to inflation and supply chain costs, companies need to be more judicious with procurement, embrace lean manufacturing and automated their processes. AI-powered intelligent demand forecasting coupled with blockchain-based supply chain transparency augments efficiency and reduces wastage.
• Debt Reduction
With rates rising, we need to break free from debt. To improve their financial stability, both Unilever and Reckitt must repay existing debt at lower rates of interest, reduce non-essential expenditure and reorient activities around high-margin offerings, just as they are doing.
• Technological Investment
Future growth relies on the necessity of digitalisation. Companies will have to build out e-commerce capabilities, deploy AI driven marketing, and enhance customer insights to remain competitive. As an entrepreneur, by using IoT you can get your logistics & supply chain automated and tracked for better efficiency & cost management.
• Sustainability Initiatives
Consumers are increasingly willing to buy sustainable and ethically sourced products. For ESG expectations and regulatory requirements, Unilever and Reckitt need to invest in biodegradable packaging, carbon reduction efforts and sustainable sourcing strategies.
The main function of budgeting is that it provides an organized way to plan an allocation of resources and control costs for an organization. It is a balance between fiscal accountability and a guide to keep organizations financially healthy by tracking spending to treatment goals. Historically, incremental budgeting has been the approach of choice, with requested budgets for each coming year being derived from the budget for the previous year with incremental changes applied (Omar & Ozyapici 2019). Though straightforward and deterministic, this approach can lack agility and induce inefficiencies and wasteful expenditure by being unable to adapt to changing market conditions.
Modern approaches to budgeting have emerged in response to these limitations. At ZBB, organizations must justify every expense anew, thus certifying cost efficiency and removing superfluous spending. But ZBB can be time-consuming and resource-intensive. 20.Activity-based budgeting: ABB allocates costs to business activities to illustrate cost visibility and efficiency. Implementing rolling forecasts that enable companies to continuously update budgets in response to real-time data can help them better adapt to rapid market shifts. Indeed, Beyond budgeting, a concept shift in financial planning, allowing for a more flexible and decentralized approach, enabling dynamic financial planning unlike a rigid annual budget, and allowing for more agile responses to ever changing external unknowns.
This tech-savvy approach to budgeting has taken financial planning to a whole new level. AI-powered analytics, machine learning, and cloud-based financial monitoring tools augment forecasting accuracy, automate data processing, and facilitate real-time budget watching (Brown et al., 2017). All of these technologies promote data-driven decision-making, minimizing manual errors and enhancing financial agility. IntroductionIn an era characterized by economic uncertainty, organizations must adapt.
Traditional Budgeting Approaches
The traditional budgeting methods such as incremental budgeting are extensively used by different organizations because they are predictable and straightforward. In incremental budgeting, you modify the previous year’s budget with a fixed percentage to address inflation, the market and the advancement of your business. It is beneficial for stability and continuity in financial planning, and allow managers to predict values of income and expenditures easily (Nguyen et al., 2018). On the other hand, the incremental budget is also criticized for being bad because it tends to repeat the same allocation of resources when they are not useful, thus generating unwanted expenditures or unnecessary allocations of resources. It breeds a “use it or lose it” attitude, in which departments spend all of their budget so that future allocations don’t get cut instead of tuning spending according to real needs.
Fixed budgeting is another popular conventional management strategy; budgets for financial plans are prepared at the start of the fiscal year and do not change regardless of market trends. Fixed budgets indeed offer direction in how the business is directed financially, but they do not have the flexibility and adaptability to work in dynamically changing business environments (Martine et al., 2017). Such inflexibility invariably causes errors in financial planning, whereby unexpected economic fluctuations, regulatory transformations, and market volatility can render initial budget sales figures moot.
However, traditional cost models still have their place in industries with stable cost structures and predictable revenue streams, including manufacturing and public sector organizations. Nonetheless, the escalating volatility of global markets has led companies to consider more responsive, performance-related budgeting techniques.
Modern Budgeting Techniques
However, to overcome these limitations of traditional budgeting, organizations have been experiencing an accelerated adoption of new-age budgeting for features as i ncreasing financial agility, cost-effective and strategic alignment.
Zero-Based Budgeting (ZBB)
Zero-based budgeting (ZBB) is a systematic approach that requires for budgets to be designed from initial stages to each financial period, as opposed to referencing previous budgets. “Every single expense has to be justified by need and value added, which drives cost efficiency and eliminates potentially wasteful spending. Zero-based budgeting — zero-based budgeting is useful for companies implementing financial restructuring or cost management optimization. It does so by advancing the alignment of every financial allocation with organizational objectives, minimizing wasteful spending and promoting accountability (José Carlos et al.,2018). However, because Zero-based budgeting is time-consuming and resource-intensive due to the amount of detailed analysis and reassessment required, it is not practical for all organizations .
Activity-Based Budgeting(ABB)
ABB stands for activity-based budgeting, a budgeting method that focuses on allocating money depending on what specific activities are involved in running the business (Cidav et al., 2020). ABB prescribes funds based on a costs per unit notion, as opposed to traditional ways of appropriating budgets to departments. It helps firms with detailed operations and organizations with complicated cost structures prioritize high-value developments and activities, making sure money is where it should be. ABB enable organizations to connect financial planning and business processes, increasing cost visibility and encouraging decision making. The impact and advantages of ABB can only be realized through extensive data collection and analysis, the complexity of which may be prohibitive for organizations that do not have adequate financial management systems in place.
Rolling Forecasts
Rolling forecasts — repeated updates to budgets (monthly, say, or quarterly), allowing organizations to bring their financial strategies up to date (insofar as possible) in the context of current data and market changes (Brown et al., 2017). On the flip side, the rolling forecasts introduces admin flexibility and provided responsiveness which enables organizations to pivot quickly in the face of uncertainties and, ideally, allocate resources accordingly. It helps in optimizing that they cut down unnecessary costs and improve forecasting accuracy which enhances financial agility and also drives business strategy. In fast-moving industries such as technology, retail, and financial services, industries where the market is constantly evolving, rolling forecasts are common-. But implementing rolling forecasts involves using complex analytical tools to support the process as well as requires a dedicated financial planning team resulting in increased operational complexity.
Beyond Budgeting
The beyond budgeting movement proposes ending the big annual budgeting round and practice in favour of decentralised management of finance and finances with authority pushed down into the business units rather than held at the corporate centre. Although not exactly the same, beyond budgeting moves your attention away from some fixed financial targets to some level of performance based financial planning with a heavy reliance on KPIs and relative benchmarking. This drives innovation, agility and accountability (since you make each team 100% greenfield on their product and see every day what does and what does not work) and is a great fit for agile organizations (Nguyen et al., 2018). However, going beyond budgeting requires a significant cultural shift, where organizations must adopt decentralized decision-making structures and real-time performance monitoring systems.
The Impact of Budgeting on Operational Performance
These budgeting approaches and styles dictate resource allocation, cost control measures, and financial accountability, all of which have a direct impact on operational performance. A well structured budgeting format provides stability but, at the same time, can create inertia and inefficiencies. In contrast, modern budgeting techniques enable greater financial agility and align with broader strategic goals, providing organizations with better operational decision-making capabilities.
According to the research of Brown et al., (2017), the organizations applying beyond budgeting principles represented with higher degree of innovation and operational efficiency resulting from their decentralized financial planning structures. However, the effectiveness of any budget approach varies from one organization to the next, depending on the industry, size, and operational complexity of that organization. [With rolling forecasts and ABB] This suits organizations whose cost structures are highly regulated (which may be the minority) less so. Similar with ZBB, whose advantages for cost-optimization could prove unfeasible for large corporations with massive financial operations.
The Role of Technology in Budgeting, Forecasting, and Management Control
With technology evolving, budgeting has changed, improving forecasting, automation, and financial decision-making. Utilizing AI-powered predictive analytics, machine learning algorithms, and cloud-based financial management systems has dramatically increased the efficiency and reliability of budgeting processes.
Artificial Intelligence and Machine Learning InBudgeting
The potential for future growth based on a history of growth trends has been revolutionized by AI (artificial intelligence) and ML (machine learning), which can scan millions of previous records and extract the potential future growth potential contained in them just by looking across the numbers. The AI-driven budgeting tools offer live tracking of these, making them tools in the hands of organizations for data-informed budgeting outcomes (Oyadomari et al., 2023). This minimizes dependence on manual estimates, so that rolling forecasts become more reliable, forecast become more accurate and therefore they lead to improved resource allocation. To put it simply, use AI financial planning systems for enterprises like Amazon and Google to avoid budgeting worldwide.
Software as a Service (SaaS) Financial Management systems
For instance, Cloud-based financial management software such as Oracle NetSuite and SAP S/4HANA streamline the budgeting process by gathering information from various business units, making it easier to access all financial data in one location. These platforms provide real-time budget tracking, automated expense reporting and collaborative financial planning features that reduce administrative burdens and improve financial transparency. Cloud systems also enhance cybersecurity and compliance through centralized management of financial data, which has regulatory controls embedded (Palermo 2018).
Data Analytics and Business Intelligence in Budgeting
Financial data visualization and real-time budgetary performance monitoring can be analysed by data analytics and business intelligence (BI) tools like Power BI and Tableau. They provide interactive reporting dashboards, what-if scenario analysis, and predictive modeling capabilities to help finance teams make data-driven decisions. It does help organizations with budgeting processes from best BI tools that spot cost-saving opportunities, identifies financial anomalies, and adapts better-profit-partitioning practices (Palermo 2018).
It sounds simple, but budgeting is an integral part of financial management that allows resource allocation, operation efficiencies, and strategic decision making. However, they are not flexible and also not appropriate enough in dynamic business environments. Traditional approaches to budgeting, such as ZBB, ABB, rolling forecasts, and beyond budgeting, are better suited for overall operational performance and offer more flexibility, cost optimisation, and strategic alignment.
Emerging technologies like AI, cloud computing, and data analytics have significantly reshaped budgeting processes to offer more accurate forecasting and financial control. In financial planning, technology-backed and flexible budgeting approaches will be imperative in driving sustainable growth and ensuring competitive edge, as companies navigate increasingly complex financial landscapes (Oyadomari et al., 2023). Companies need to evaluate their budgetary requirements carefully and leverage modern-day financial planning tools to build better, nimble and financially-resilient organizations.
Investment appraisals are a fundamental part of the capital budgeting process, ensuring that financial choices can be undertaken to maximize their wealth for stakeholders while considering risk and return (Bagienska 2017). It is clear that as a Director of a public listed company, we should not only be concerned with having a high value capital expenditure proposal to table before the CEO, but also be mindful of how well you are getting the investment appraisal techniques to be considered by using the needs you evaluated well. These techniques have to account for the time value of money (TVM) to determine future cash flows and determine if the investment is a sound financial venture or not. Investment appraisal techniques fall into two broad categories: these include discounting cash flow (DCF) methods that account for the time value of money, and non-discounting cash flow methods which do not.
Here, I will analyse Net Present Value (NPV) and Payback Period (PBP), two of the most widespread investment appraisal methods. Both NPV (a DCF method that accounts for the present value of future cash flows), and PBP (a non-discounted method) return the time required for the initial investment to turn profitable. All these methods come with their strengths and weaknesses and, thus, be deployed under different business and economic conditions.
Discounted Cash Flow Method: Net Present Value (NPV)
NPV is a cash flow Discounting method that calculate the present value of future cash inflows and outflows Discounted to a required rate of return, also known as the discount rate. It is calculated with the following formula:
NPV=∑ Ct/(1+r)t −C0
Where:
Ct = Cash inflow at time ttt
C0 = Initial investment
t = time period
r = discount rate
Application and Example
Assume that a company is considering a $10 million investment in advanced manufacturing equipment that is expected to generate the following cash flows:
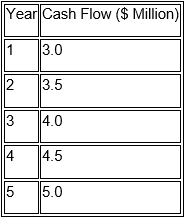
If the company's cost of capital is 10%, the NPV can be calculated as follows:
NPV= 3.0 /(1.1)1 + 3.5 /(1.1)2 + 4 /(1.1)3 + 4.5 /(1.1)4 + 5 /(1.1)5
= $4.80 million
If, after discounting the cash flows, the NPV is positive, it means the investment will add value to the company and it's well worth proposing to the CEO. If NPV is negative→ Re-evaluate or reject the project. We got $4.80 million hence project will be accepted
Advantages of NPV
Time Value of Money (TVM) accounts – Ensures future cash flows are appropriately valued.
Considers All Cash Flows – Gives a complete assessment of an investment’s potential for profit.
Consistent with Shareholder Interests – Positive NPV leads to increased shareholder value
Limitations of NPV
Dependent on Discount Rate Correctness – Little alterations in discount rate produce large variations in NPV.
Complexity – May need direct cash flow forecasting and financial modelling.
Non-Discounted Cash Flow Method: Payback Period (PBP)
Explanation and Formula
The Payback Period (PBP) measures how quickly an investment recovers its initial cost without considering the time value of money. It is calculated as:
PBP=Initial Investment / Annual Cash Inflows
Application and Example
Using the same investment example of $10 million, if the cash inflows for the first three years are as follows:
Year Cumulative Cash Flow ($ Million)
The payback period is between Year 2 and Year 3, which can be calculated as:
PBP=2+(10−6.5)4=2.875
= 2.875 years
This means that it takes the company about 2 years and 10.5 months to recoup its investment.
Advantages of PBP
Straightforward and Easy to Calculate — there are no discounting or complicated projections involved.
Relevant for Liquidity: a way for businesses to see if they can get their hands back on cash for reinvesting
Limitations of PBP
Neglects the Time Value of Money (TVM) – Fails to consider the decreasing real value of future cash flows.
Forgets Long-Term Value — Considers only recovery time, not return on investment.
Comparison and Recommendation
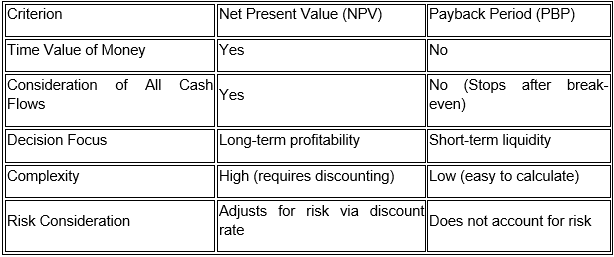
Since both the methods have their own advantages and disadvantages, I would recommend that NPV (Net Present Value) be used as the primary investment appraisal method, as it supports shareholder value maximization by taking into account the time value of money and all future cash flows associated with an investment. Nonetheless, PBP is one of the adjunctive tools to be used to evaluate liquidity risks and measure the time the business can recover the invested capital.
Techniques for investment appraisal — including a range of financial models used to determine the attractiveness of an investment — are essential for making investments that do not compromise the risk/reward balance. NPV is a strong discounted cash flow tool that considers the time value of money, which is why it is one of the most widely used tools for long term strategic investments. PBP serves as a quick measure of liquidity, but is not sufficient for judging an investment’s overall profitability.
As Director presenting CEO with high dollar capital expenditure proposal, I would focus on NPV for profit and PBP for liquidity. These two approaches complement each other and facilitate a comprehensive review of the investment that aims to safeguard shareholder interests while maximizing financial performance in the face of varying economic conditions.
Bagienska, A. (2017). Value Added Statement - A Relevant Instrument for Integrated Reporting. e-Finanse, 12(4), pp.92–104. doi:https://doi.org/10.1515/fiqf-2016-0011.
Brown, J.L., Fisher, J.G., Peffer, S.A. and Sprinkle, G.B. (2017). The effect of budget framing and budget-setting process on managerial reporting. Journal of Management Accounting Research, 29(1), pp. 3–44.
Chen, A. and Gong, J.J. (2019). Accounting comparability, financial reporting quality, and the pricing of accruals. Advances in Accounting, 45, p.100415. doi:https://doi.org/10.1016/j.adiac.2019.03.003.
Cidav, Z., Mandell, D., Pyne, J., Beidas, R., Curran, G. and Marcus, S. (2020). A pragmatic method for costing implementation strategies using time-driven activity-based costing. Implementation Science, 15, pp. 1–15.
Cohen, S. and Karatzimas, S. (2017). Accounting information quality and decision-usefulness of governmental financial reporting. Meditari Accountancy Research, 25(1), pp.95–113. doi:https://doi.org/10.1108/medar-10-2015-0070.
Davydov, D. (2016). Debt structure and corporate performance in emerging markets. Research in International Business and Finance, 38, pp.299–311. doi:https://doi.org/10.1016/j.ribaf.2016.04.005.
Desai, M.A. (2017). The wisdom of finance : discovering humanity in the world of risk and return. Boston: Houghton Mifflin Harcourt.
Fenyves, V., Pisula, T. and Tarnoczi, T. (2023) Investigation of accounting manipulation using the beneish model: hungarian case", Economics and Sociology, 16(4), pp. 347-363.
Gadau, L. (2016). A new dimension in activity reporting and the performance of the enterprise – non-financial reporting.. Economic Series, 16(2), p.101. doi:https://doi.org/10.26458/1628.
Hitchner, J.R. (2016). Financial Valuation. Somerset: John Wiley and Sons, Incorporated.
Huaman-Nope, A.G., Serrato-Cherres, A., Ramos-Cavero, M. and Cordova-Buiza, F. (2023), Reputational risk and stock price: a corporate management analysis’, Managerial Finance, 49(7), pp. 1113-1130.
Investing.com (2024). Unilever posts higher-than-estimated 2023 net profit, shares rise. [online] Available at: https://in.investing.com/news/unilever-posts-higherthanestimated-2023-net-profit-shares-rise-432SI-4009074.
Jin, L., Taffler, R., Eshraghi, A. and Tosun, O.K. (2020). Fund manager conviction and investment performance. International Review of Financial Analysis, 71, p.101550. doi:https://doi.org/10.1016/j.irfa.2020.101550.
José Carlos, T.O., Paulo Sérgio Lima, P.A., Ronaldo Gomes Dultra-de-Lima, Octavio Ribeiro Ribeiro Mendonça Neto and Maria Carolina, G.R. (2018). Flexible budgeting influence on organizational inertia and flexibility. International Journal of Productivity and Performance Management, 67(9), pp. 1640–1656.
Martine, C., Kristof, S. and Alexandra, V.A. (2017). Management control for simulating different types of creativity: The role of budgets. Journal of Management Accounting Research, 29(3), pp. 23–26. doi: https://doi.org/10.2308/jmar-51795.
Needles, E. and Powers, M. (2019). Financial Accounting. Mason, Oh: South-Western Cengage Learning.
Nguyen, D.H., Weigel, C. and Hiebl, M.R.W. (2018). Beyond budgeting: review and research agenda. Journal of Accounting and Organizational Change, 14(3), pp. 314–337.
Omar, F.T. and Ozyapici, H. (2019). The Impact of the Magnitude of Overhead Costs on the Difference Between ABC and TDABC Systems. Foundations of Management, 11(1), pp. 81–92.
Oyadomari, J. C., Chen, Y., Dultra-de-Lima, R. G., and Neto, O. R. d. M. (2023). Exploring the influences of cybernetic and dynamic controls on flexibility and performance. Brazilian Administration Review, 20(3), pp. 1-19.
Palermo, T. (2018). Accounts of the future: A multiple-case study of scenarios in planning and management control processes. Qualitative Research in Accounting and Management, 15(1), pp. 2-23.
Reckitt (2023). Annual Report and Accounts. [online] Available at: https://www.reckitt.com/media/fi2eyuhj/reckitt_ar23_final_interactive.pdf.
Unilever (2023). Annual Report and Accounts. [online] Available at: https://www.unilever.com/files/92ui5egz/production/b09c3510ee7cec58440d5f044f02bdefe85aa186.pdf


Essay: 10 Pages, Deadline: 2 days
They delivered my assignment early. They also respond promptly. This is excellent. Tutors answer my questions professionally and courteously. Good job. Thanks!
![]() User ID: 9***95 United
States
User ID: 9***95 United
States
Report: 10 Pages, Deadline: 4 days
After sleeping for only a few hours a day for the entire week, I was very weary and lacked the motivation to write anything or think about any suggestions for the writer to include in the paper. I am glad I chose your service and was pleasantly pleased by the quality. The paper is complete and ready for submission to the professor. Thanks!
![]() User ID: 9***85 United
States
User ID: 9***85 United
States
Assignment: 8 Pages, Deadline: 3 days
I resorted to the MBA assignment Expert in the hopes that they would provide different outcomes after receiving unsatisfactory results from other assignment writing organizations, and they genuinely are fantastic! I received exactly what I was looking for from this writing service. I'm grateful.
![]() User ID: 9***55
User ID: 9***55
Assignment: 13 Pages, Deadline: 3 days
Incredible response! I could not believe I had received the completed assignment so far ahead of the deadline. Their expert team of writers effortlessly provided me with high-quality content. I only received an A because of their assistance. Thank you very much!
![]() User ID: 6***15 United
States
User ID: 6***15 United
States
Essay: 8 Pages, Deadline: 3 days
This expert work was very nice and clean.expert did the included more words which was very kind of them.Thank you for the service.
![]() User
ID: 9***95 United
States
User
ID: 9***95 United
States
Report: 15 Pages, Deadline: 5 days
Cheers on the excellent work, which involved asking questions to clarify anything they were unclear about and ensuring that any necessary adjustments were made promptly.
![]() User ID: 9***95 United
States
User ID: 9***95 United
States
Essay: 9 Pages, Deadline: 5 days
To be really honest, I can't bear writing essays or coursework. I'm fortunate to work with a writer who has always produced flawless work. What a wonderful and accessible service. Satisfied!
![]() User ID: 9***95
User ID: 9***95

Essay: 12 Pages, Deadline: 4 days
My essay submission to the university has never been so simple. As soon as I discovered this assignment helpline, however, everything improved. They offer assistance with all forms of academic assignments. The finest aspect is that there is also an option for escalation. We will get a solution on time.
![]() User ID: 9***95 United
States
User ID: 9***95 United
States
Essay: 15 Pages, Deadline: 3 days
This is my first experience with expert MBA assignment expert. They provide me with excellent service and complete my project within 48 hours before the deadline; I will attempt them again in the future.
![]() User ID: 9***95 United
States
User ID: 9***95 United
States
