
HI6037 Business Analytics Fundamentals Report
1. Critically evaluate the role of business analytics in supporting decision making in a modern organisation, with consideration of the role of culture and values in affecting the achievement of business goals.
2. Discuss and evaluate Business Analytics frameworks, techniques and tools used in gathering, analysing, and managing data, and applying them to enhance decision making.
3. Critically evaluate the challenges and critical success factors associated with selecting, implementing and using Business Analytics solutions in organisations.
4. Develop innovative solutions to contemporary business scenarios through the application and adaption of Business Analytic skills.
5. Critically reflect upon trends in business analytics and evaluate the impact that these will have on organisations in the future.
This assessment will be conducted in groups of four students. It is essential that all group members are from the same class. Groups will be formed within the first two weeks of the semester, and students are expected to work within these groups for the entirety of the semester on the group case study.
Firstly, your group is required to use Microsoft Power BI to analyse the provided data files (W11 Uluru Goods.xlsx and Location.xlsx) and generate reports that address the questions in the provided template (HI6037 Assignment Template.docx). For each question, your group should insert a screenshot of the report and provide a brief explanation.
Secondly, your group is required to create three dashboards using Power BI for the data sets. Each dashboard should include at least six visualization charts and one slicer to illustrate different aspects of the data analysis. More creative and effective dashboard designs will result in higher marks for this section. Additionally, your group must provide a brief explanation for each dashboard.
Thirdly, your group is required to create a video that provides a detailed explanation of your answers to the questions and the three dashboards. The video presentation should not exceed 20 minutes in length. All group members must actively participate in the presentation. The video must be uploaded to YouTube or another accessible platform, and the link should be included in your report. Ensure that the video is accessible to the markers.
Finally, your group is required to prepare a single document in either MS Word or OpenOffice format. This document should contain a cover page and answers to questions, three dashboards, and the link to the video. The file must be submitted via Blackboard.
.png)
.png)
.png)
.png)
.png)
.png)
.png)
.png)
.png)
.png)
.png)
.png)
.png)
.png)
.png)
.png)
Overview
This dashboard allows the users to gain in-depth understanding of sales activity by concentrating on a few key performance indicators such as sales revenue, gross profit, product sales and sales region, discount analysis etc. By analysing such key indicators, the dashboard provides information of high value with respect to the sales of the company and its performance. This data visualization instrument assists in the comprehension of all key elements relating to sales dynamics and gauging the possibility of their enhancement.
Top-Performing Stores: The “Sum of Gross_Profit by Store_desc” chart identifies the [Store Name] as the store with maximum gross profit. Such intelligence helps identify the profitable stores and those that are underperforming on gross and net profits while providing other locations a standard to fast track their efforts. It is crucial to know the breakthrough factors for the most successful store to leverage the location strategies for improvement in sub-competitors.
Seasonal Sales Patterns: The “Sum of Sales_Revenue by Date” chart suggests that there is a conclusive variability of sales within a year and that [Peak Season] has the highest sales volume. In view of such seasonal patterns, the development of marketing strategies, levels of stock, human resources during the busy periods are made to the fullest, while also ensuring rush periods are followed by a phase where only little stock remains.
Popular Products: As per the Сhart “Sum of Quantity_Sold by Prod_desc”, the bestselling product can be identified. The identification of popular products gives opportunity to concentrate on advertising these products and maintaining optimum stock of such products within the organization in order to cater for the said demand.
.png)
Figure 1: Sales Performance Analysis Dashboard
(Source: Obtained from PowerBI)
Regional Sales Differences: The “Max of Sales_Revenue by Region and Region” chart reveals that sales differ depending on the market – in this instance, the region had the most notable sales revenue. Selling products in these areas is only made easier if one understands and differentiates the differentiating factors and targets the market accordingly.
Category Performance: From the chart “Sum of Sales_Revenue by Category” it can be concluded that such category is the most sales generating category for the businesses. This data is important in respect of resource allocation as the firm will be able to direct more marketing and inventory towards the leading categories thus improving their presence in the market.
Discount Impact: There was some positive correlation between sales revenue and the “Sum of Discount_Percent and Sum of Sales_Revenue” as shown in the charts. This merely indicates that sales are most likely to be enhanced with the offering of discounts but caution should be taken to avoid incurring losses. Appreciating such a relationship is useful in designing effective pricing and promotional strategies for optimal revenue generation.
In order to further motivate current sales to improve, and to gain further understanding, the following recommendations are suggested:
1. Drill-down Functionality: Allow drill-downs that enable users to analyze subsets of the available sales such as particular groups of customers or specific product sets.
2. Customer Segmentation: If customer data is available, customers’ sales performance by factions can be evaluated to highlight marketing towards customers of greatest value.
3. Time Series Forecasting: Appropriate development of time series data allows an attempt to estimate future sales that aids in effective management of inventories and resource allocation.
4. Correlation Analysis: Investigate the potential relationships between a pair or more variables, such as sales dollars and discount percent so as to identify some relationships, if any. This analysis can help in formulating pricing strategies aimed at maximizing sales without compromising on profitability.
Such strategic enhancement in these areas gives the company the wherewithal to improve its overall performance in sales, address the competitive challenges, and seize the prospects that are vitally needed for growth.
Overview
The second dashboard documents a more in-depth analysis of the sales performance in different regions, taking into account several dimensions for a deeper appreciation of the sales performance. It consists of quite a number of other important parameters.
1. Regional Sales Comparison: Competition is among sales revenue earned in different regions, which aids in establishing the underperforming or over performing areas and those that need intervention.
2. State-Level Analysis: The sales dashboards under this region focus on the different states and how much sales have been realized under each state which shows state trends for state performance.
3. City-Level Analysis: Its further drills down the sales revenues by each individual city in the appropriate state which gives the insight into cities performances which can shape suitable strategies.
4. Discount Analysis: This component assesses the relationship between discount and sales revenue, giving a picture of promotions in sales and sales revenue.
Regional Sales Leaders: The Sum of Sales Revenue by State and Sum of Sales Revenue by Cities Charts show high and low sales revenue performance on regional and city level. Understanding these more successful markets enables the company to use resources effectively and concentrate them in places, where highest value would be achieved.
.png)
Figure 2: Regional Sales Analysis Dashboard
(Source: Obtained from PowerBI)
Regional Disparities: These maps and charts display large regional section and geographic divisional variations in sales. This gap can help the company how to deal with the issues that made other geography areas perform poorly and where on performing areas need sales focus adaptations strategies. That therefore can make the company policies regarding allocation of resources and the level of promotion in that particular market.
Discount Impact: The chart "Sum of Sales_Revenue by Discount_Percent" clearly shows that there exists a relationship of revenues contribution and the discounts offered, implying that revenues are enhanced by discounting. This helps optimize the sales strategies which integrate the desired revenue and the effect on profitability. This knowledge helps the company rethink its pricing strategies in the long run.
To make the most out of the regional context and the analysis of the sales by regions, it is suggested that such measures will be undertaken:
1. Targeted Marketing: The regional analysis should be employed to help design campaigns and targets for each region and city that exhibits higher selling prospects. Such campaigns should enhance focus by increasing sales in campaigns deemed critical.
2. Performance Benchmarking: Estimates of expected sales at state and regional levels should also be put in place to measure the level of penetration achieved and the gaps that need to be plugged. Compliance and monitoring of these benchmarks in a regular manner may assist in keeping individuals accountable towards the sales targets.
3. Customer Segmentation: Depending on the availability of customer information, it would be possible to cut down,” sales by segment within a given region” so as to locate market segments with greater returns. Knowing customers’ likes can enable them to give appropriate products and use the right communication strategies.
4. Competitive Analysis: Analyse the competitive environment of the market in specified regions to understand where the business can position itself unique from competitors. When assessing the rivals, one must look for strengths and weaknesses of their positioning to meet the gaps of the consumers.
Using the outlined approaches, it is possible for the organization to achieve its objectives and take advantage of the sales and regional variations in order to boost sales performance of the company.
Overview
The third dashboard is dedicated to product performance analysis, highlighting a thorough investigation of the relevant sales and earning metrics. It comprises a number of important features:
1. Product Category Sales: This metric measures the amount of sales revenue generated, and in terms of which product category, therefore determining what category generates the highest revenue for the company.
2. Discount Impact: The dashboard measures the effect of discounts on sales revenue, thus helping understand the effectiveness of various strategies in terms of sales.
3. Product Sales: It measures the performance of sales of a particular product, providing a detail view of how individual products are performing.
4. Product Profitability: It assesses the gross profit from various products sold, helping to determine the most profitable items for the business.
Top-Selling Categories: The "Sum of Sales_Revenue by Category" chart highlights the leading categories in sales. Understanding which categories sell most helps the firm in making decisions on how to deploy its efforts to ensure that items that are in high demand are quickly put on the shelves or are marketed well.
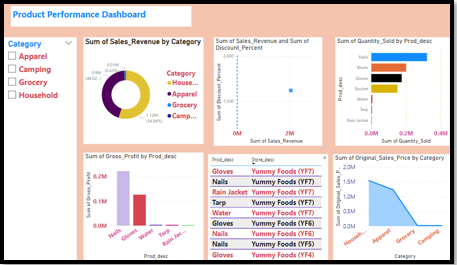
Figure 3: Product Performance Analysis Dashboard
(Source: Obtained from PowerBI)
Discount Effectiveness: The “Sum of Sales_Revenue and Sum of Discount_Percentage” chart depicts the extent to which discounts can lead to sales. This understanding is very important as it serves to illustrate how the discounts offered can also affect the overall revenue informing on the pricing of people and their efforts to promote.
Product-Level Performance: The “Sum of Quantity_Sold by Prod_desc” and “Sum of Gross_Profit by Prod_desc” charts show the products surpassed in sales as well as profits. Determining where those product blockades lie will enable the company to channel its marketing strategies for items that will not only be in demand but also provide revenues optimizing stock management and advertising measures.
Product-Store Relationships: The “Sum of Original_Sales_Price by Category” chart suggests what the sales of each product will be and in which stores. Knowing how certain products do in relation to the places where they are sold can be useful in determining the placement of some stocks and selling purposes of the different markets.
In order to improve product performance in line with the findings of the dashboard the proposals listed below are made:
1. Product Portfolio Optimization: Define the product mix in a way to understand which products do not perform well. Articles which have been identified with low performance should be stopped this will avail resources which should be channelled to the more productive products.
2. Pricing Optimization: Each product method has to be assessed in terms of its profitability potential as well as its competitive advantage. This evaluation could enable the firm a proper compromise between drawing clients in the guise of lower prices as well as earning credible profits.
3. Promotional Strategies: Specific products need to have particular promotional techniques applied in order enhance the sales, and also control the stock levels. With proper strategies in place, sluggish sellers can be promoted, and best sellers can be maximally sold as well.
4. Customer Preference Analysis: Study existing and potential customers buying habits to uncover gaps in the offerings. An insight into consumer behaviour can assist in the conception of novel products that will have a won over specific target markets.
In short, the third dashboard offers resources on the performance metrics related to the products. If the company applies the recommended improvements, it shall be able to enhance even more the optimization of its product portfolio, pricing strategies and promotional activities achieving high sales and profitability of the business.
Oey, E., Harno, S.S.S. and Zain, C., 2021, August. Developing integrated performance dashboards with Power BI–a case study in a medium-size Manufacturer. In 2021 International Conference on Information Management and Technology (ICIMTech) (Vol. 1, pp. 265-270). IEEE. Accessed from : https://ieeexplore.ieee.org/abstract/document/9535105/
Khosravi, M.R., 2024. ACI: a bar chart index for non-linear visualization of data embedding and aggregation capacity in IoMT multi-source compression. Wireless Networks, 30(5), pp.3697-3705. Accessed from: https://link.springer.com/article/10.1007/s11276-021-02626-x
Tang, D., Chen, M., Huang, X., Zhang, G., Zeng, L., Zhang, G., Wu, S. and Wang, Y., 2023. SRplot: A free online platform for data visualization and graphing. PLoS One, 18(11), p.e0294236. Accessed from: https://journals.plos.org/plosone/article?id=10.1371/journal.pone.0294236
Neto, M.P. and Paulovich, F.V., 2020. Explainable matrix-visualization for global and local interpretability of random forest classification ensembles. IEEE Transactions on Visualization and Computer Graphics, 27(2), pp.1427-1437. Accessed from: https://ieeexplore.ieee.org/abstract/document/9222255/
Tseng, H.Y., Chen, C.L., Lin, Y.C., Chuang, M.C., Hsu, W.H., Hsiao, W.Y., Chen, T.M., Wang, M.T., Huang, W.C., Chen, C.Y. and Wu, B.R., 2022. Using real-time visualization system for data-driven decision support to achieve lung protective strategy: a retrospective observational study. Critical Care, 26(1), p.253. Accessed from: https://link.springer.com/article/10.1186/s13054-022-04091-0
Beroš, I., Hlupić, N. and Džapo, F., 2021, September. Usage of BI Tools in Analysis of the Tomas Croatia 2019 Survey. In 2021 44th International Convention on
Information, Communication and Electronic Technology (MIPRO) (pp. 1335-1340). IEEE. Accessed from: https://ieeexplore.ieee.org/abstract/document/9597033/
Bibliography
Benjamin, L.B., Amajuoyi, P. and Adeusi, K.B., 2024. Leveraging data analytics for informed product development from conception to launch. GSC Advanced Research and Reviews, 19(2), pp.230-248.
Lee, S., Lim, D., Moon, Y., Lee, H. and Lee, S., 2022. Designing a business intelligence system to support industry analysis and innovation policy. Science and Public Policy, 49(3), pp.414-426.
Trujillo, R.E.M., Henríquez, S.D.M. and Lengua, M.A.C., 2023. Business Intelligence to Optimize Decision-Making in a Telecommunication Company. International Journal of Engineering Trends and Technology, 71(8), pp.85-101.


Essay: 10 Pages, Deadline: 2 days
They delivered my assignment early. They also respond promptly. This is excellent. Tutors answer my questions professionally and courteously. Good job. Thanks!
![]() User ID: 9***95 United
States
User ID: 9***95 United
States
Report: 10 Pages, Deadline: 4 days
After sleeping for only a few hours a day for the entire week, I was very weary and lacked the motivation to write anything or think about any suggestions for the writer to include in the paper. I am glad I chose your service and was pleasantly pleased by the quality. The paper is complete and ready for submission to the professor. Thanks!
![]() User ID: 9***85 United
States
User ID: 9***85 United
States
Assignment: 8 Pages, Deadline: 3 days
I resorted to the MBA assignment Expert in the hopes that they would provide different outcomes after receiving unsatisfactory results from other assignment writing organizations, and they genuinely are fantastic! I received exactly what I was looking for from this writing service. I'm grateful.
![]() User ID: 9***55
User ID: 9***55
Assignment: 13 Pages, Deadline: 3 days
Incredible response! I could not believe I had received the completed assignment so far ahead of the deadline. Their expert team of writers effortlessly provided me with high-quality content. I only received an A because of their assistance. Thank you very much!
![]() User ID: 6***15 United
States
User ID: 6***15 United
States
Essay: 8 Pages, Deadline: 3 days
This expert work was very nice and clean.expert did the included more words which was very kind of them.Thank you for the service.
![]() User
ID: 9***95 United
States
User
ID: 9***95 United
States
Report: 15 Pages, Deadline: 5 days
Cheers on the excellent work, which involved asking questions to clarify anything they were unclear about and ensuring that any necessary adjustments were made promptly.
![]() User ID: 9***95 United
States
User ID: 9***95 United
States
Essay: 9 Pages, Deadline: 5 days
To be really honest, I can't bear writing essays or coursework. I'm fortunate to work with a writer who has always produced flawless work. What a wonderful and accessible service. Satisfied!
![]() User ID: 9***95
User ID: 9***95

Essay: 12 Pages, Deadline: 4 days
My essay submission to the university has never been so simple. As soon as I discovered this assignment helpline, however, everything improved. They offer assistance with all forms of academic assignments. The finest aspect is that there is also an option for escalation. We will get a solution on time.
![]() User ID: 9***95 United
States
User ID: 9***95 United
States
Essay: 15 Pages, Deadline: 3 days
This is my first experience with expert MBA assignment expert. They provide me with excellent service and complete my project within 48 hours before the deadline; I will attempt them again in the future.
![]() User ID: 9***95 United
States
User ID: 9***95 United
States
